
Prompt
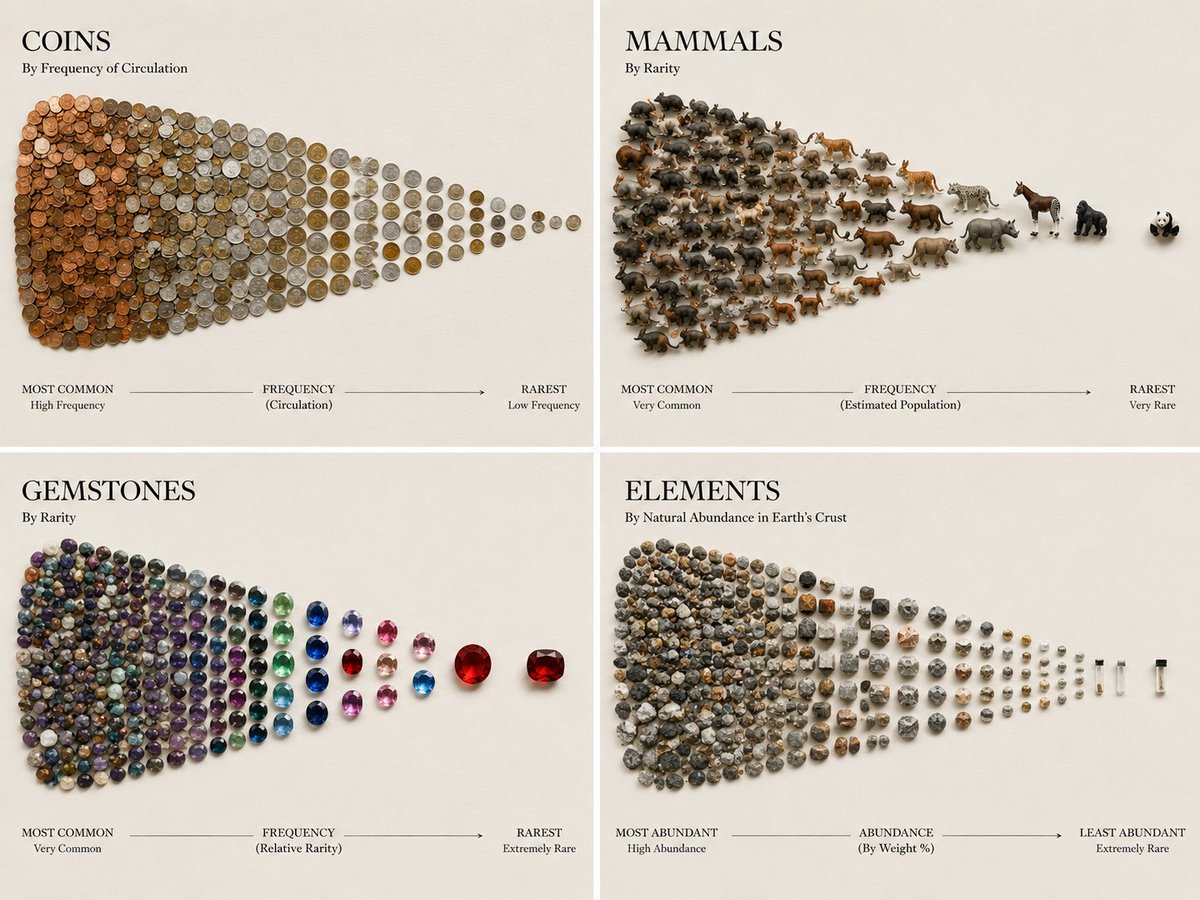
Rarity Density Flat Lay
Design a clean density-map flat lay with objects packed from common to rare, forming a clear silhouette and labeled like an editorial infographic.
About this style
This concept turns collection data into a visual pattern, using tight clustering on one side and sparse placement on the other to show rarity at a glance. It’s useful for posters, educational graphics, and editorial data visuals. Swap in any theme, shape, and labels to create a different frequency map.
Raster visual concept only; text and layout will be rendered as an image, not an editable infographic file.