
Design
AI Infographic Generator
Create an infographic image from a topic and your own facts. Explore illustrated explainers, ingredient layouts and visual comparison prompts.
Start creatingA starter prompt is ready in the generator. Make it your own.
Prompt
Create a vertical infographic explaining how a coffee bean becomes a cup of coffee. Arrange six clearly separated stages: harvest, process, dry, roast, grind, brew. Use simple hand-drawn illustrations, a warm cream background, dark brown headings and restrained green accents. Keep the reading order obvious and labels short. Include no statistics or claims beyond the supplied process, and leave generous space between sections.
View full promptCollapse prompt
Create a vertical infographic explaining how a coffee bean becomes a cup of coffee. Arrange six clearly separated stages: harvest, process, dry, roast, grind, brew. Use simple hand-drawn illustrations, a warm cream background, dark brown headings and restrained green accents. Keep the reading order obvious and labels short. Include no statistics or claims beyond the supplied process, and leave generous space between sections.
Make it your own
An infographic makes a small set of facts easier to scan. Choose a structure before a style: a process, a comparison, a labeled object or a short visual summary. These examples show different ways to combine illustrations, headings and supporting labels in one image.
Explore prompts and examples
13 examples. Open an image to see its original prompt, then create your own version.
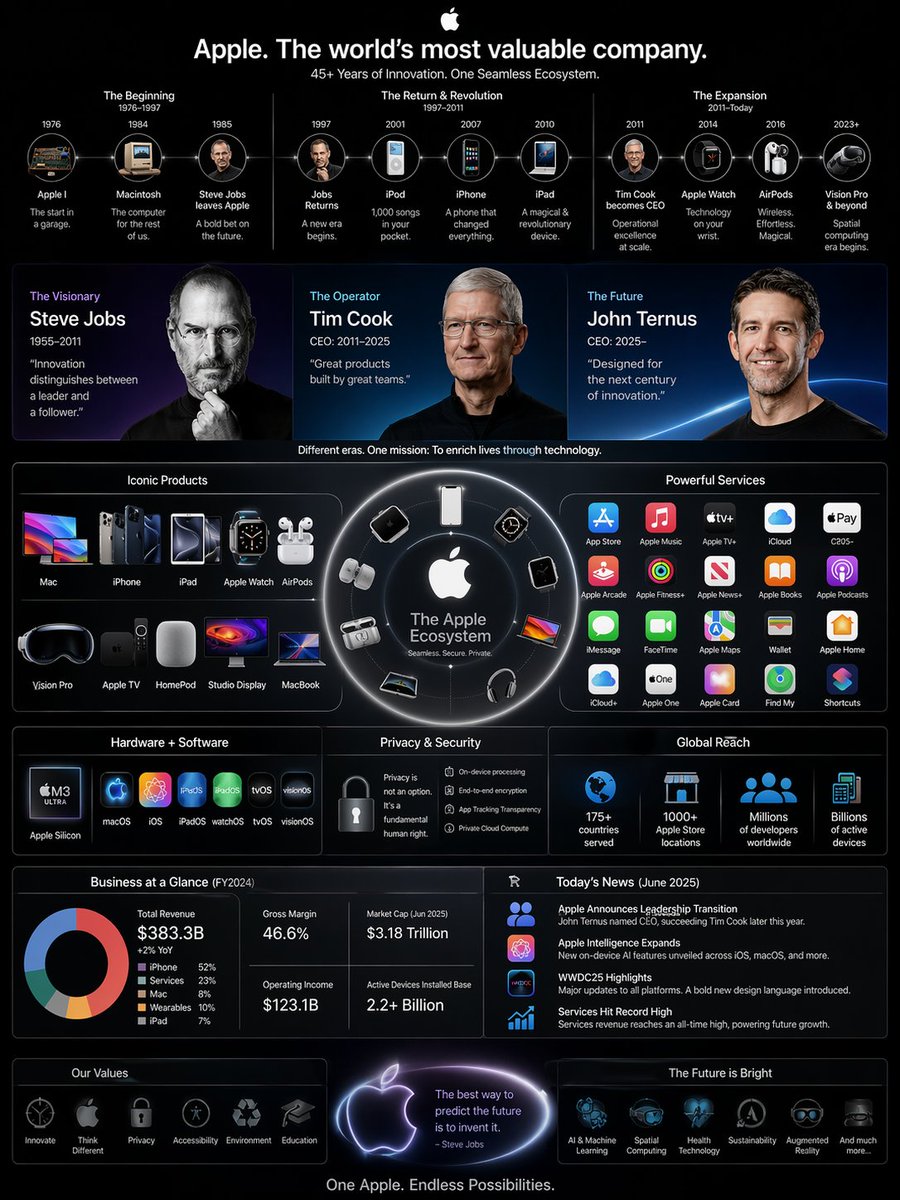 Apple Business Empire Infographic
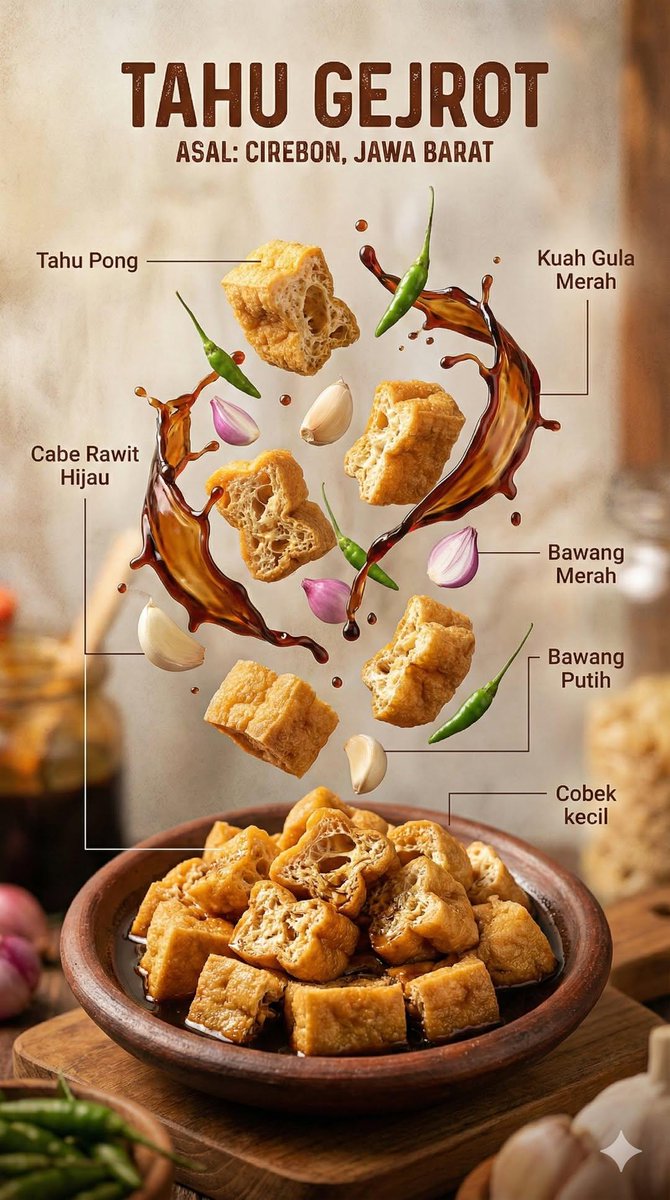 Indonesian Food Infographic
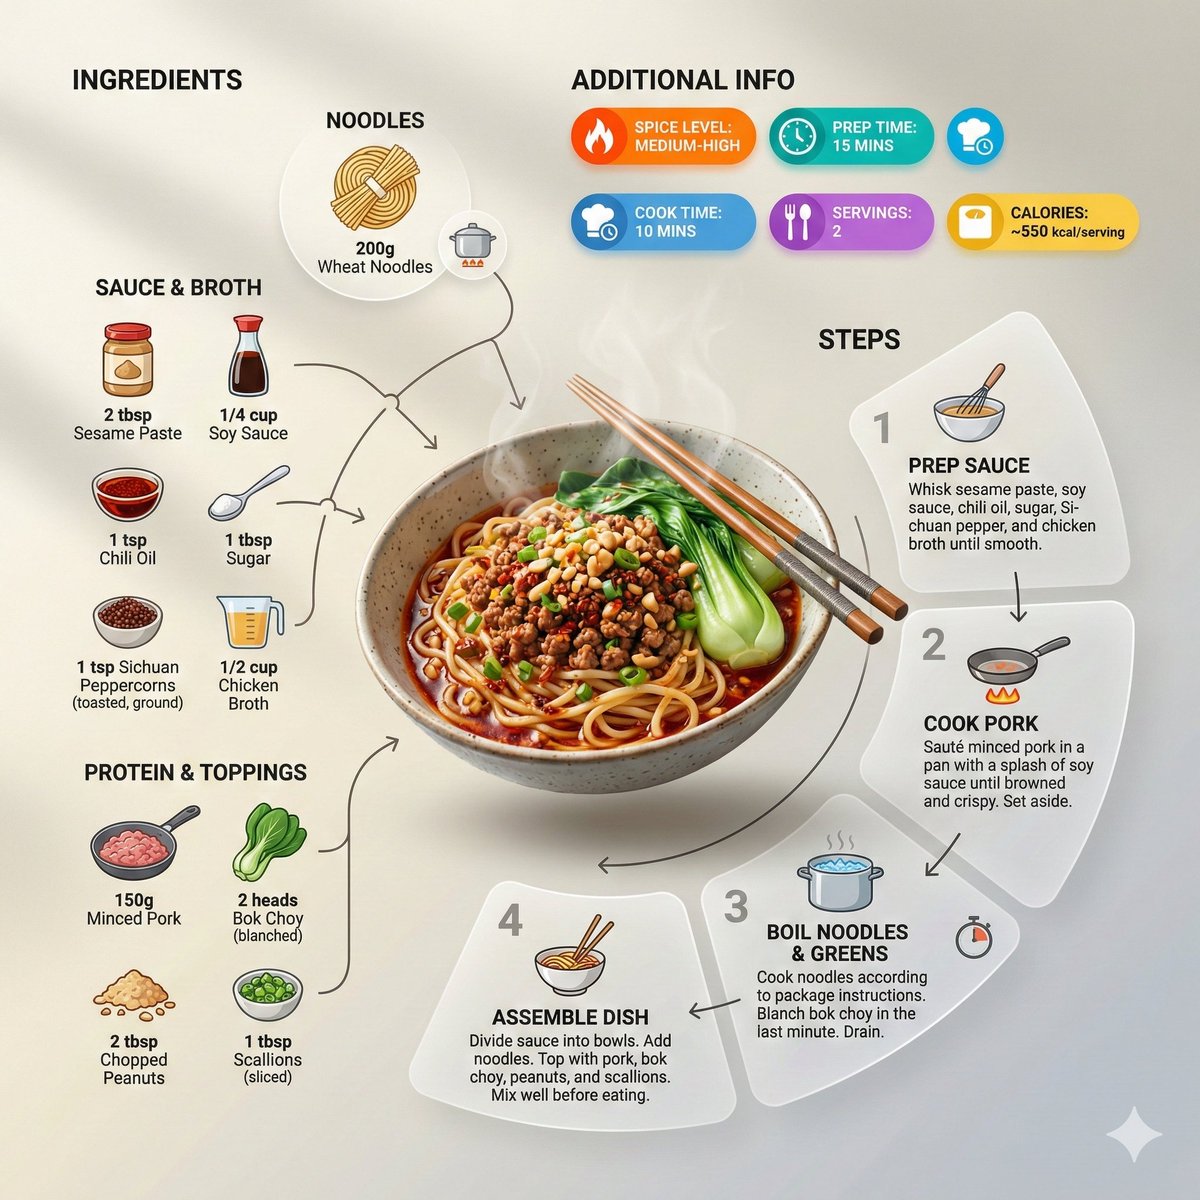 Noodle Recipe Infographic
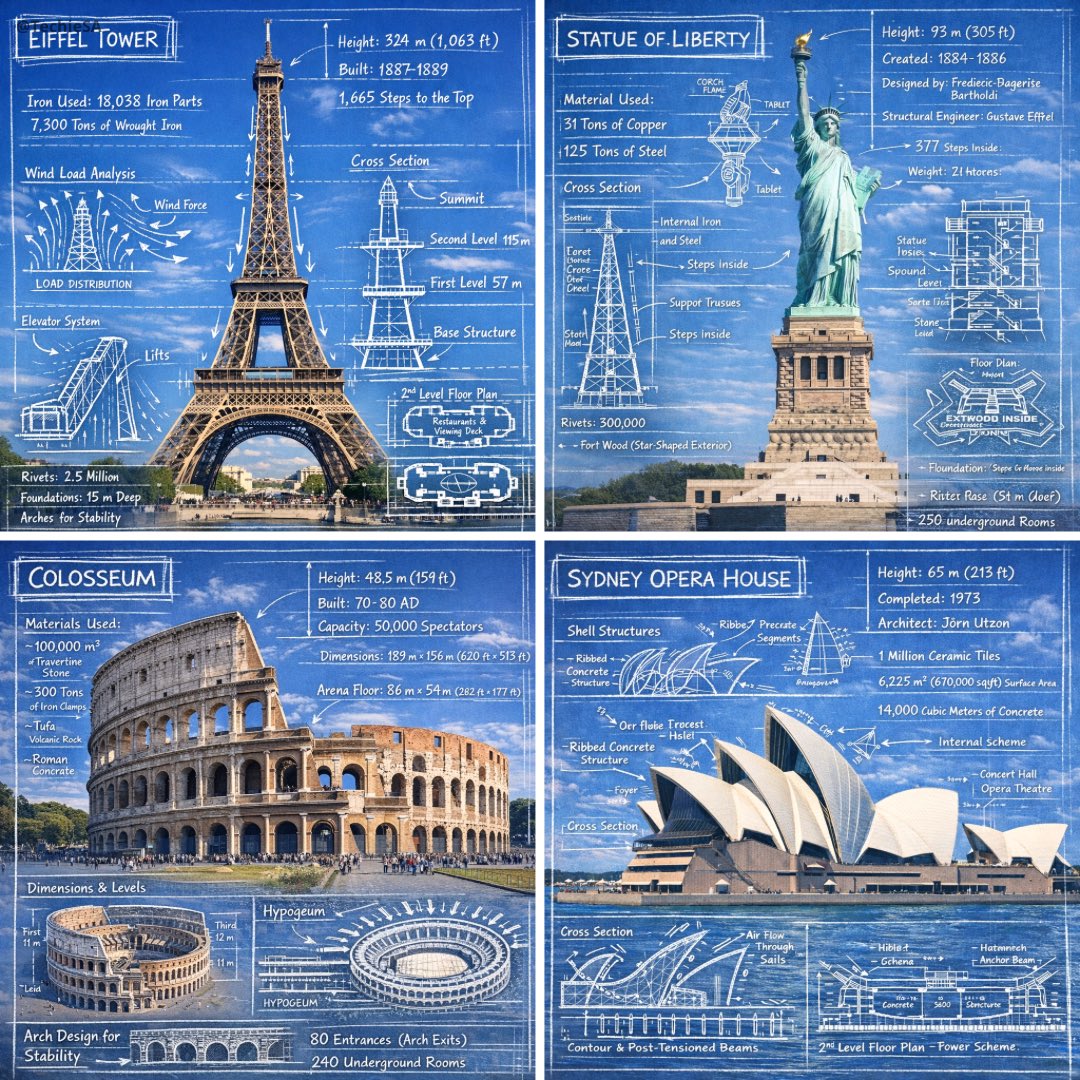 Landmark Blueprint Infographic
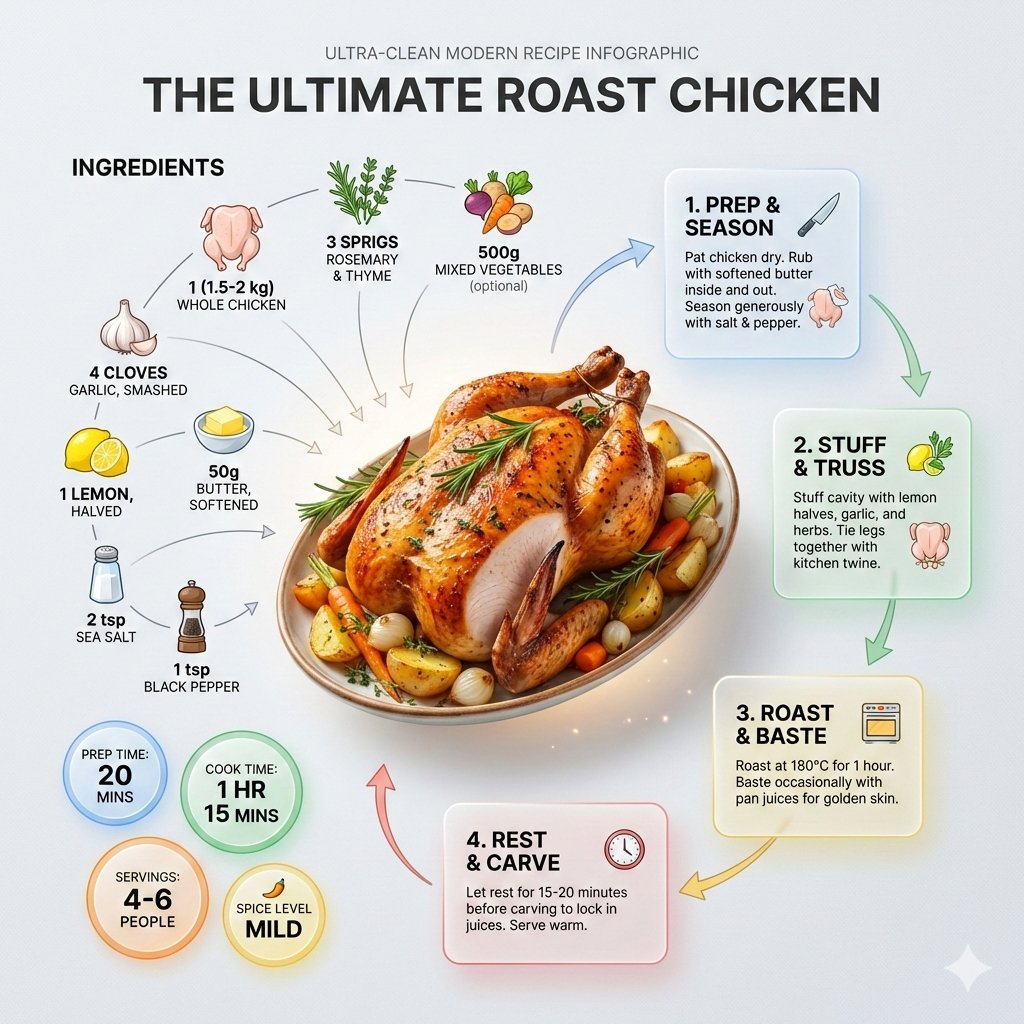 Roast Chicken Recipe Infographic
 Floating Dessert Infographic
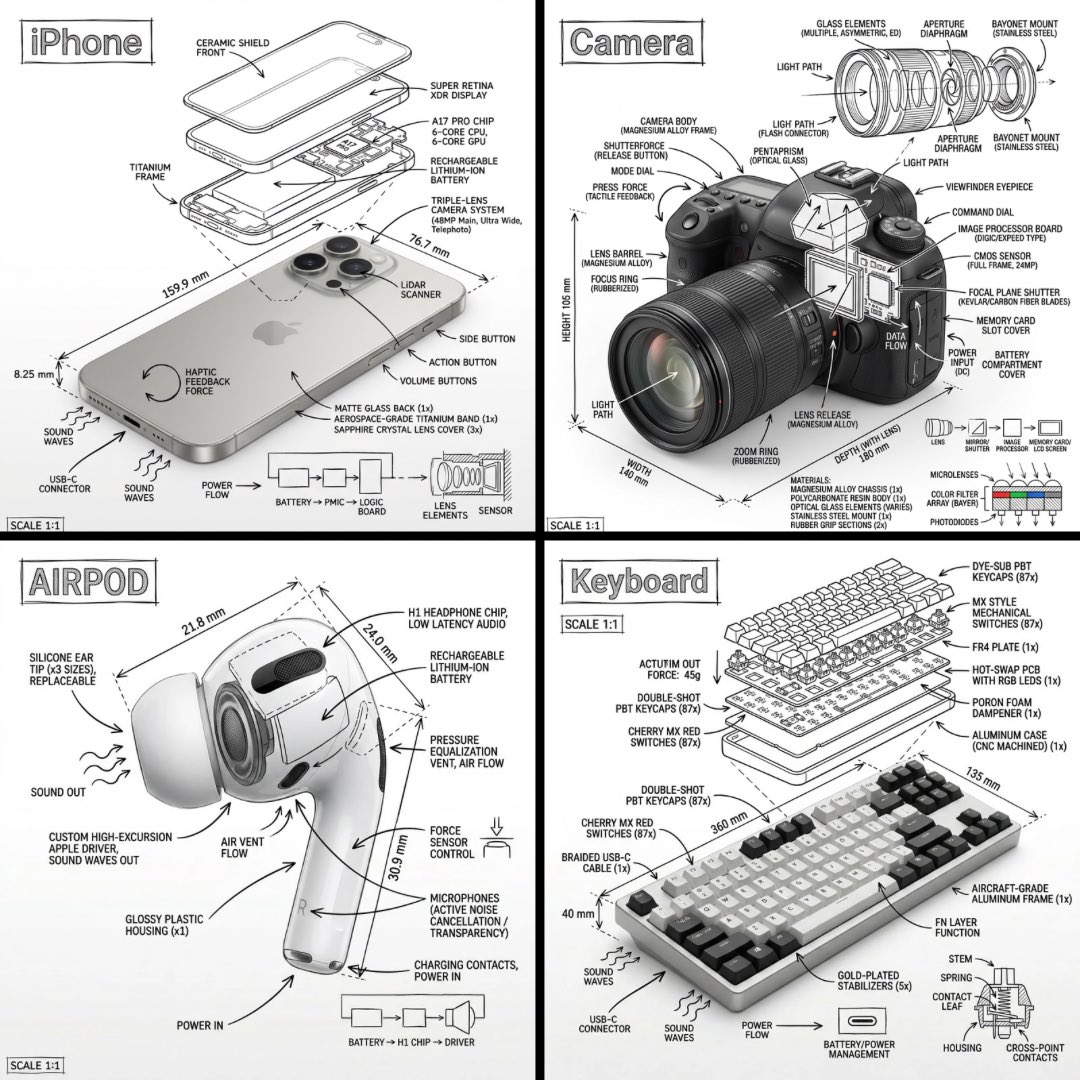 Technical Product Infographic
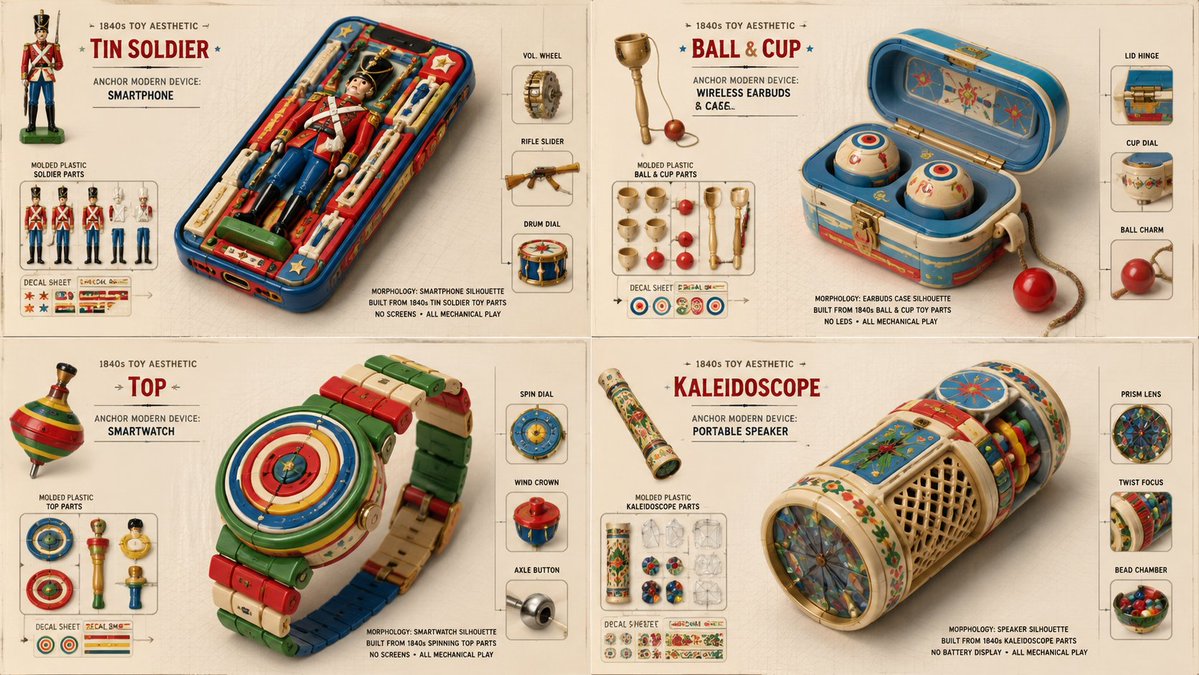 1840s Toy Device Infographic
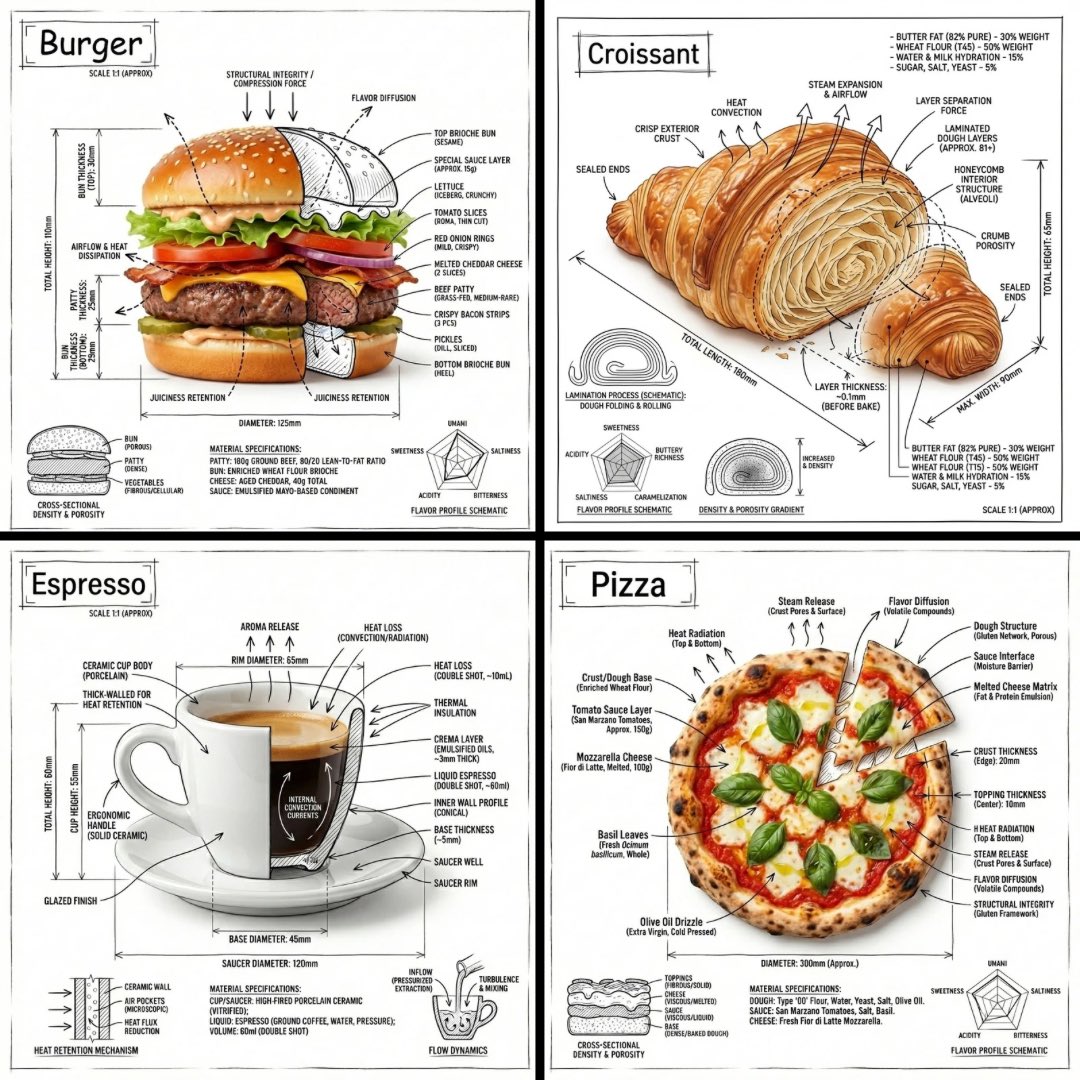 Annotated Burger Infographic
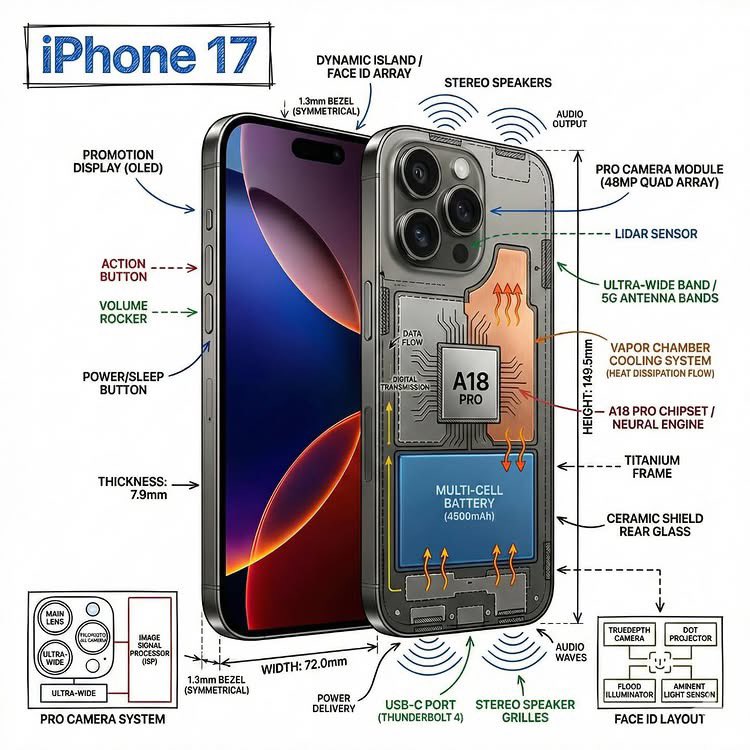 Annotated Product Cutaway Infographic
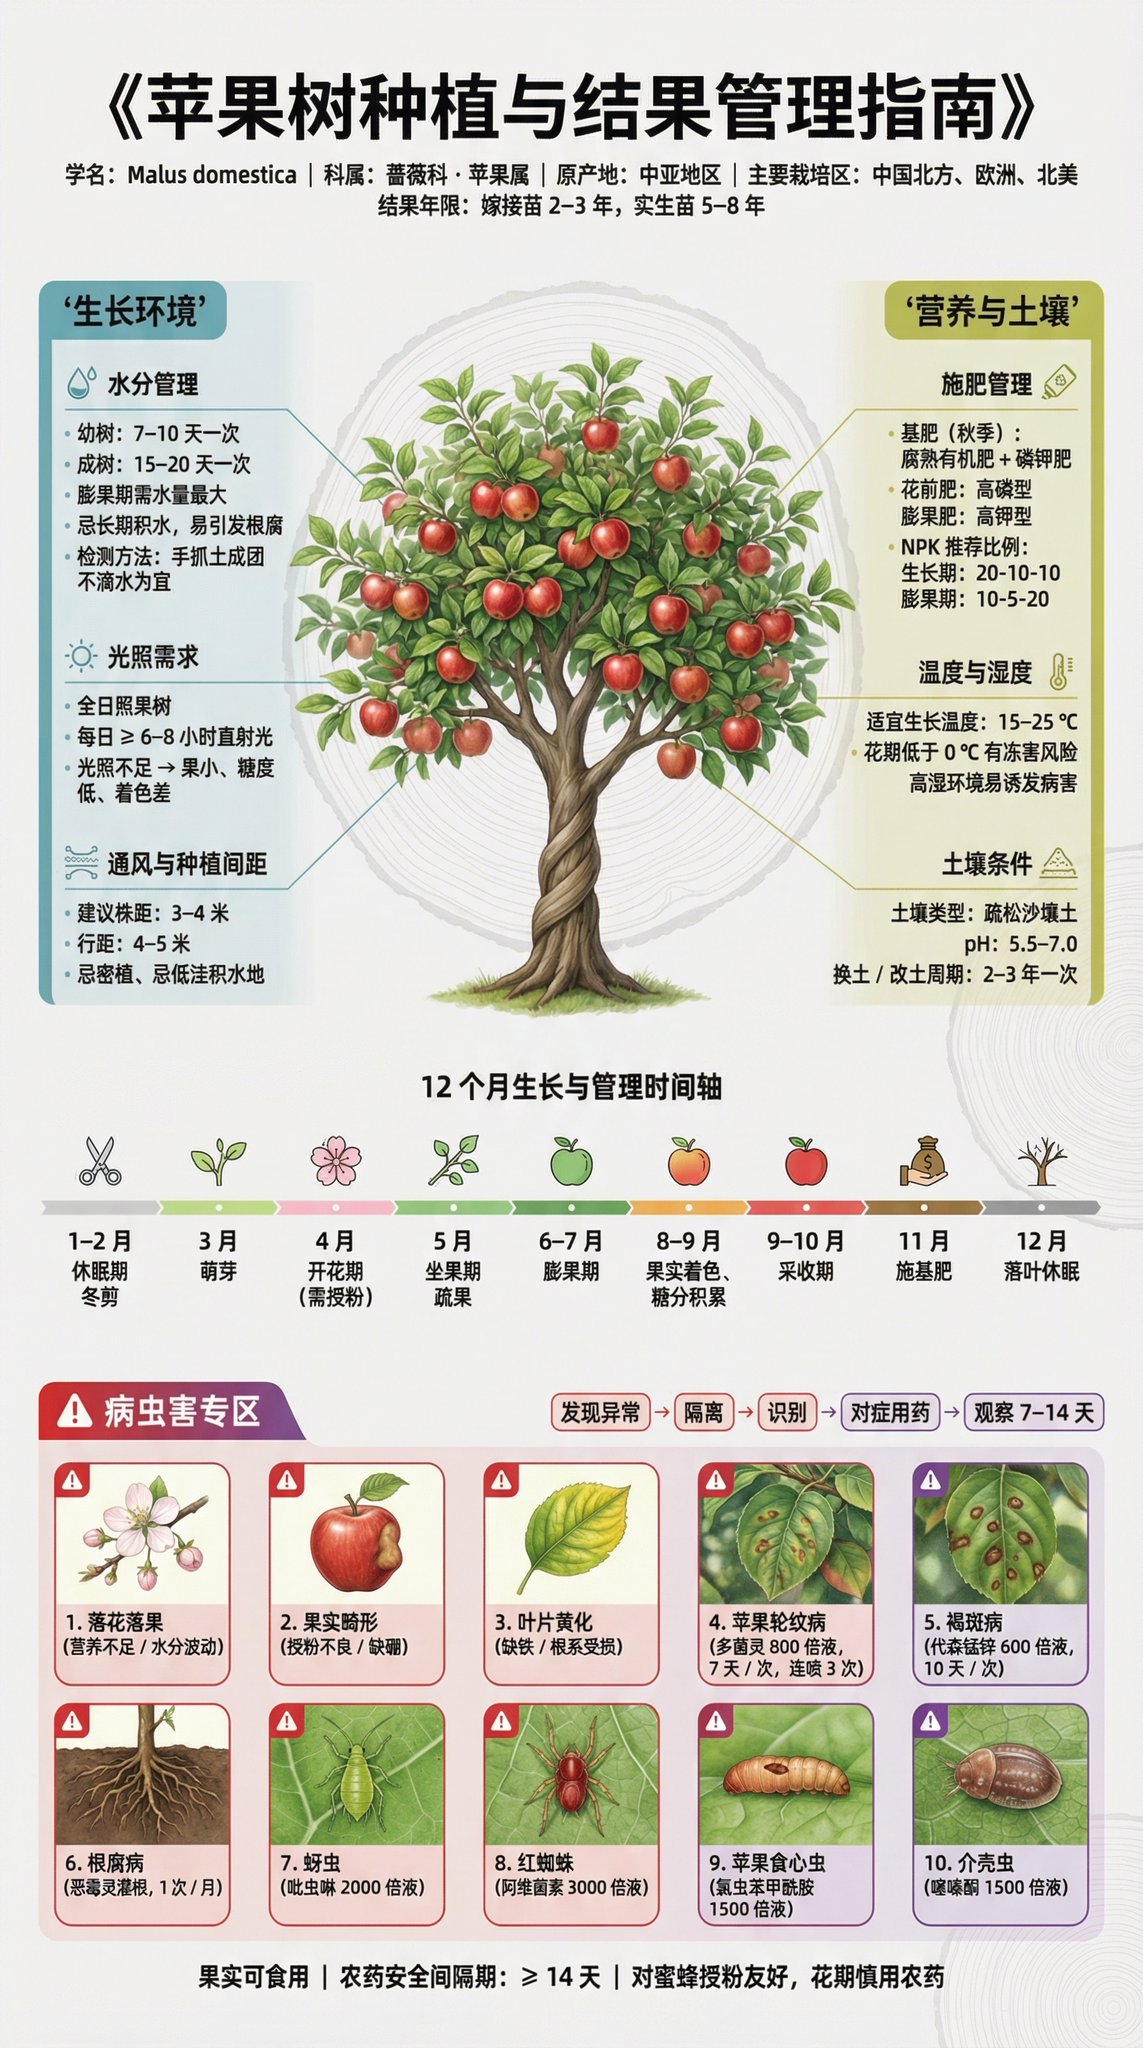 Apple Tree Infographic Poster
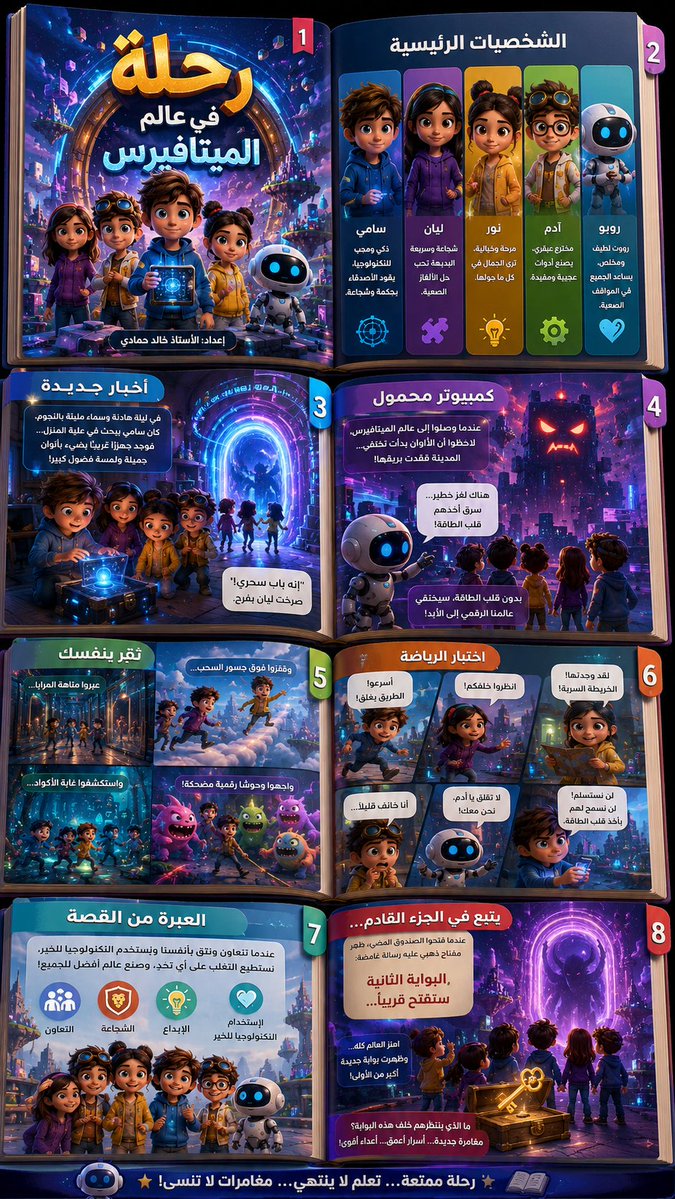 Arabic 3D Storybook Infographic
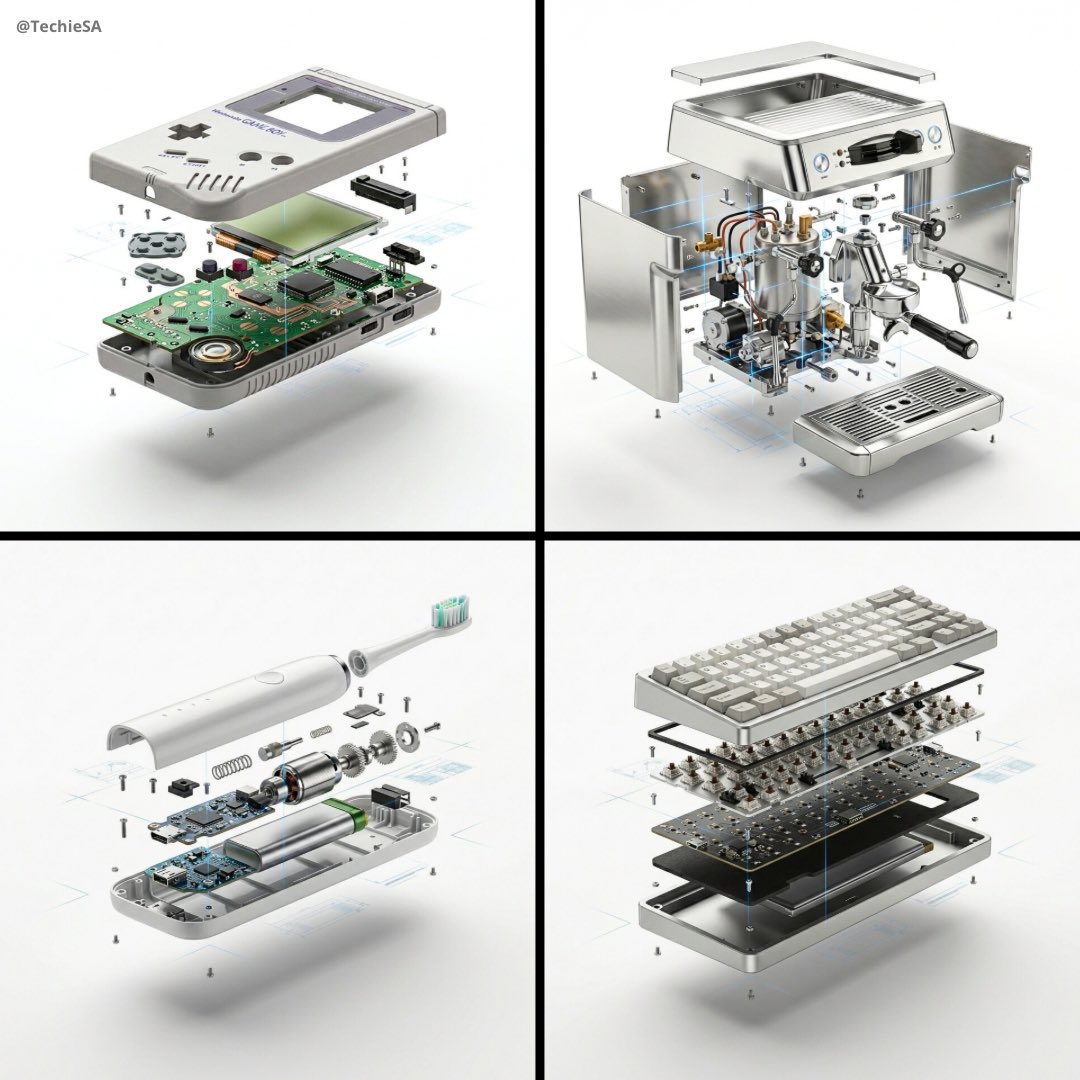 Exploded Product Ad Layout
Choose a reading order
A process needs a beginning and an end; a comparison needs matching rows or columns. Tell the generator which structure to use and how many blocks to include. A clear hierarchy usually helps more than adding decorative arrows to a crowded layout.
Bring the information with you
Supply the facts, labels and numbers you want shown. The image generator can explore their visual arrangement, but it is not a research or data-validation tool. Review every label and verify that chart sizes, arrows and relationships communicate the supplied information correctly.
Keep text within the image readable
Use one main takeaway and a few short labels. Dense paragraphs and tiny annotations tend to lose clarity when the image is viewed on a phone. If your project needs editable charts or frequently changing figures, use the generated image as a visual direction for a layout tool.
Common questions
- Can I turn an article into an infographic?
- Extract the key points first and paste those into the prompt. A short, verified outline gives you more control than asking an image model to interpret a long article.
- Is the result an editable chart?
- The result is an image. Check the factual content and use a separate design or charting tool if you need editable data or individual graphic elements.